
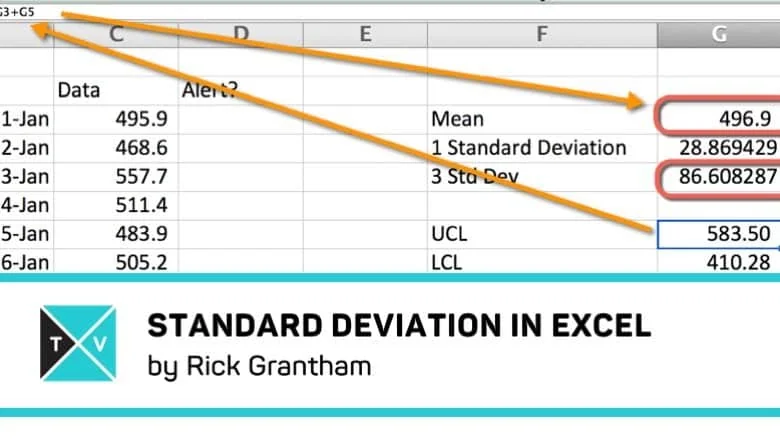
To calculate standard deviation in Excel, use =STDEV.S(range) for sample data or =STDEV.P(range) when your range contains the full population. For most business datasets, I use STDEV.S because the worksheet usually contains a sample of sales, tickets, expenses, or observations rather than every possible value.
Once you have the standard deviation, compare each value against the mean. A common alert band is three standard deviations from the mean: upper limit = mean + (3 * standard deviation) and lower limit = mean - (3 * standard deviation).
Quick Summary
- Use
STDEV.Sfor sample data andSTDEV.Pfor complete population data.- The older
STDEVandSTDEVPfunctions still work, but Microsoft lists them as compatibility functions.- Three standard deviations cover about 99.73% of values in a normal distribution, which makes 3-sigma limits useful for alerting.
- Download the updated workbook: standard-deviation-example.xlsx
Which Standard Deviation Function Should You Use?
Use STDEV.S when your Excel range is a sample and STDEV.P when it is the full population. That choice matters because sample standard deviation adjusts for the fact that a sample is estimating a larger group, while population standard deviation treats the data as complete.
| Excel function | Use it when | Example |
|---|---|---|
STDEV.S(range) | Your worksheet has a sample from a larger process, customer set, or time period. | =STDEV.S(C3:C127) |
STDEV.P(range) | Your worksheet contains every value in the population you want to measure. | =STDEV.P(C3:C127) |
STDEVA(range) | You intentionally want text and logical values included in the calculation. | =STDEVA(C3:C127) |
Older workbooks may use STDEV() and STDEVP(). They are still available for compatibility, but the modern names are clearer: STDEV.S replaced STDEV, and STDEV.P replaced STDEVP.
When Standard Deviation Is Useful
Standard deviation is useful when you want to separate normal variation from values that deserve attention. Executives, managers, and small business owners can waste time reacting to every bump in a chart. A control limit gives you a more disciplined trigger.
I usually want at least 30 data points before leaning on the result. The smaller the range, the more one unusual value can distort the calculation. I also check whether the data is roughly normal. If traffic spikes by 5x after a launch, or one unusually large sale throws off revenue, the mean and standard deviation need context before they become alert rules.
How to Calculate the Mean

The mean is the average of your data points. Standard deviation measures spread around that mean, so this is the starting point. In the example workbook, the data points live in cells C3:C127, so the mean is:
=AVERAGE(C3:C127)

How to Calculate One Standard Deviation
Use STDEV.S() for the sample-style workflow in this tutorial. Inside the parentheses, enter the same data range you used to calculate the mean:
=STDEV.S(C3:C127)
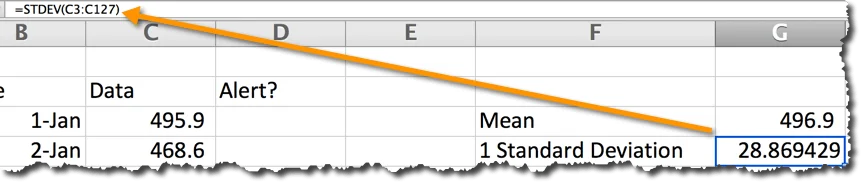
If your range is the complete population, use =STDEV.P(C3:C127) instead. If you are updating an older workbook, replacing STDEV(C3:C127) with STDEV.S(C3:C127) keeps the sample-standard-deviation intent explicit.
What Do 1, 2, and 3 Standard Deviations Mean?
In a normal distribution, a predictable share of values falls within one, two, or three standard deviations of the mean. This is the reason standard deviation works well for simple alert bands.
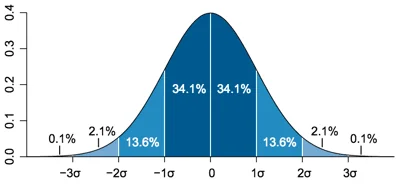
- 1 standard deviation covers about 68.27% of values in perfectly normal data.
- 2 standard deviations cover about 95.45%.
- 3 standard deviations cover about 99.73%.
- 4 standard deviations cover about 99.994%.
The key point: if your data is normal and a value lands beyond three standard deviations, it is unusual enough to review. If your data is skewed, seasonal, or full of one-time events, treat the limit as a prompt to investigate rather than a final verdict.
How to Calculate 3 Standard Deviations
To calculate three standard deviations, multiply the STDEV.S result by 3:
=STDEV.S(C3:C127)*3
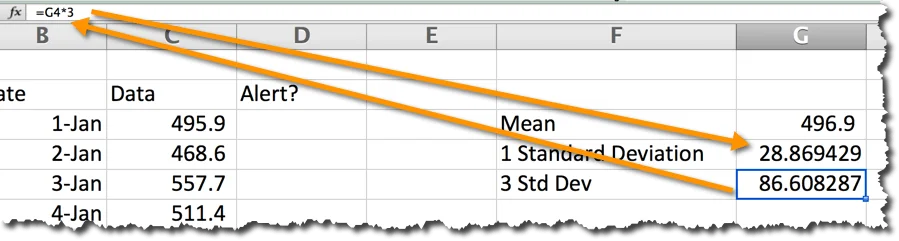
You can keep the standard deviation in one cell and multiply that cell by 3, or write the full formula directly. In a dashboard, I prefer separate cells for mean, standard deviation, and the multiplier because it is easier to audit later.
How to Set Control Limits
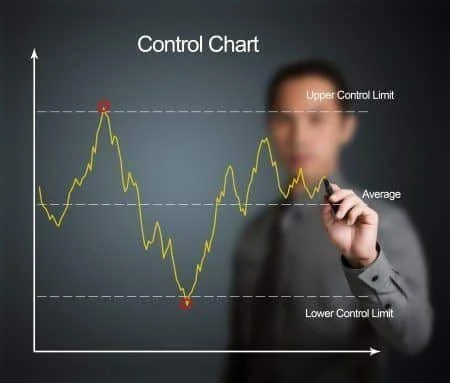
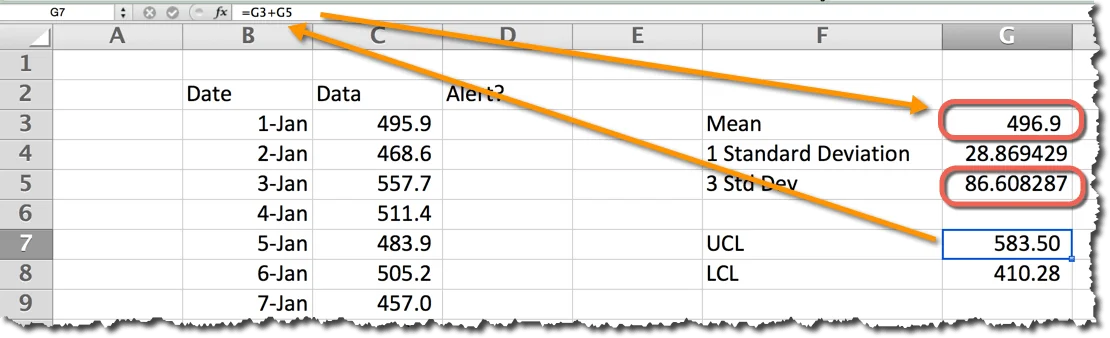
Control limits turn the standard deviation into an action rule. In the example, UCL means upper control limit and LCL means lower control limit. In a control chart, these are the lines that show when the process may be outside normal variation.
For a 3-sigma setup:
- Upper control limit:
=mean + (3 * standard_deviation) - Lower control limit:
=mean - (3 * standard_deviation)
If the mean is 496.9 and three standard deviations equals 86.6, the upper control limit is 583.5 and the lower control limit is 410.3.
Three sigma is conservative because only about 0.27% of values fall outside that range in perfectly normal data. You can use one or two standard deviations for a more sensitive alert, but expect more false alarms.
How to Set Alerts
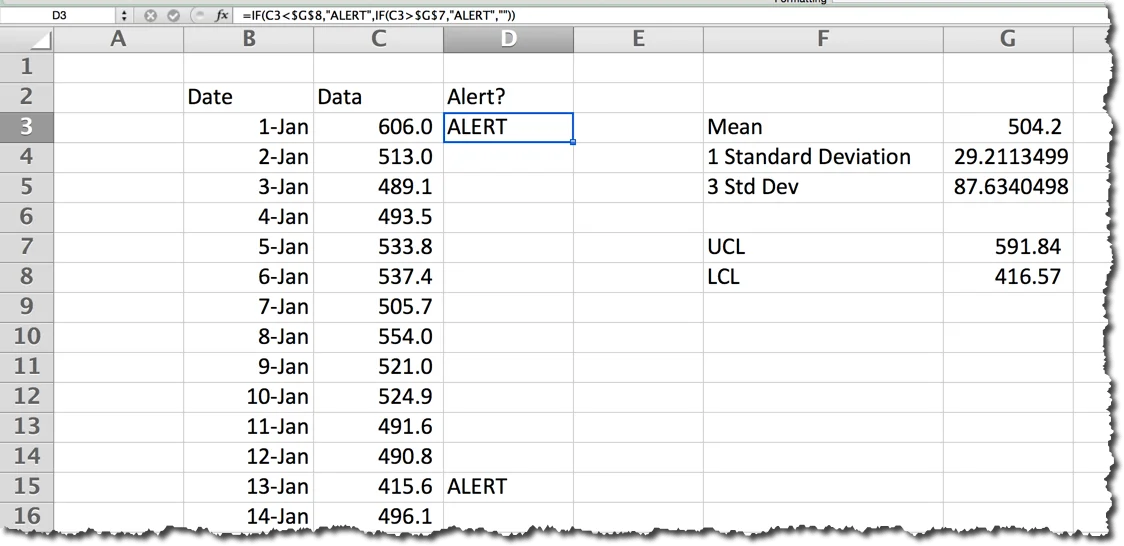
Now bring it together with an IF statement. If the value is lower than the LCL or higher than the UCL, return ALERT; otherwise return a blank cell.
Here is the basic pattern:
=IF(OR(C3<$B$7,C3>$B$6),“ALERT”,"")
Conditional formatting can also work well here. The important part is not the exact alert formula. The useful part is that the alert is tied to normal variation rather than a gut reaction to every high or low number.
Download the Sample
Download the updated Excel sample workbook. It includes sample values, AVERAGE, STDEV.S, STDEV.P, and 3-sigma control-limit formulas.
FAQ
Should I use STDEV.S or STDEV.P?
Use STDEV.S when your worksheet contains a sample. Use STDEV.P only when your range contains the entire population. Most day-to-day business worksheets are samples, so STDEV.S is usually the better default.
Is STDEV deprecated?
STDEV still works for old workbook compatibility, but the clearer modern function is STDEV.S. Likewise, STDEVP maps to STDEV.P. Updating the names makes the workbook easier to understand.
Why use three standard deviations for alerts?
Three standard deviations create a conservative alert band. In normal data, about 99.73% of values fall inside the mean plus or minus three standard deviations, so values outside the band are worth checking.
Attribution: “Standard deviation diagram” by Mwtoews. Licensed under CC BY 2.5 via Wikimedia Commons – http://commons.wikimedia.org/wiki/File:Standard\_deviation\_diagram.svg#/media/File:Standard\_deviation\_diagram.svg


Comments (5)
Historical comments preserved from the WordPress archive. Commenting is no longer active.
Very nice )
Thanks Dmitry 🙂
Great, clean & easy!
Thanks Stramilov
This is a great tutorial for calculating standard deviation in excel.