
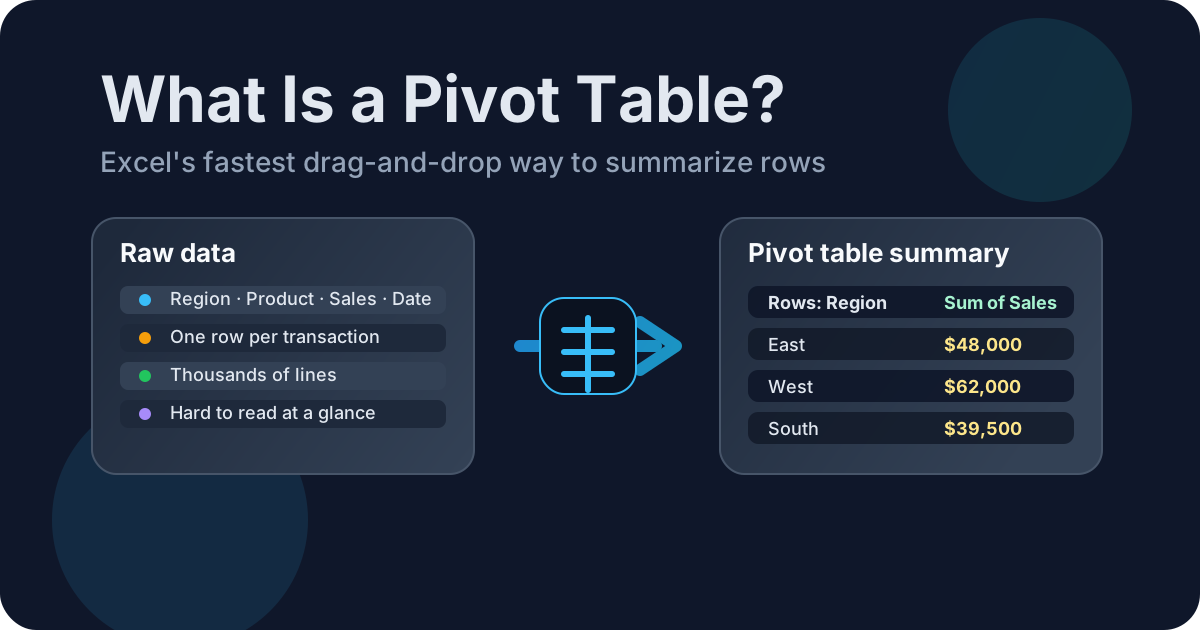
A pivot table is Excel’s fastest way to turn a long list of rows into a short, useful summary. If you have sales data, orders, or any other table with repeated categories, a pivot table lets you ask questions like “How much did each region sell?” or “Which product has the most rows?” without building a pile of formulas first.
At a glance: the keyword behind this article, “what is a pivot table,” gets 12,100 monthly searches and sits at KD 9 in US keyword data (DataForSEO Labs, 2026-07-02). That’s a clear sign that beginners want a plain-English explanation and a quick first win.
Key takeaways
A pivot table’s value is speed: one summary view instead of line-by-line scanning. Microsoft’s PivotTable docs show the tool can start from a table, range, external data, or the data model, and the page behind this article still sees 12,100 monthly searches at KD 9.
- A pivot table summarizes data by dragging fields into Rows, Columns, Values, and Filters.
- It is best for grouped reporting, not row-by-row calculations.
- You can refresh it when your source data changes.
- Pivot tables are great for date grouping, category comparisons, and quick reporting.
What a pivot table does in Excel
A pivot table collapses repeated records into a summary view, which is why it handles counts, totals, averages, and percentages so well. Microsoft’s support docs show the same tool can start from a table, a range, external data, or the data model, so it is more flexible than it looks.
In practice, a pivot table can give me:
- totals
- counts
- averages
- minimums and maximums
- percentage breakdowns
- grouped date summaries
If I want to compare categories quickly, a pivot table is usually the cleanest tool in Excel. If I want a precise row-level result, I use a formula instead.
A simple pivot table example
A tiny example makes the payoff obvious: six sales rows become a four-row regional report with a 72,000 grand total. That kind of compression is why pivot tables feel magical—same data, much less noise, and the answer is visible at a glance.
| Region | Product | Sales |
|---|---|---|
| East | Widget | 12000 |
| East | Gadget | 9000 |
| West | Widget | 17000 |
| West | Gadget | 15000 |
| South | Widget | 8000 |
| South | Gadget | 11000 |
If I build a pivot table from that data, I can summarize sales by region in seconds:
| Region | Sum of Sales |
|---|---|
| East | 21,000 |
| West | 32,000 |
| South | 19,000 |
| Grand Total | 72,000 |
That is the real value of a pivot table: the raw rows are still there, but the report becomes much easier to read.
How to create a pivot table in Excel
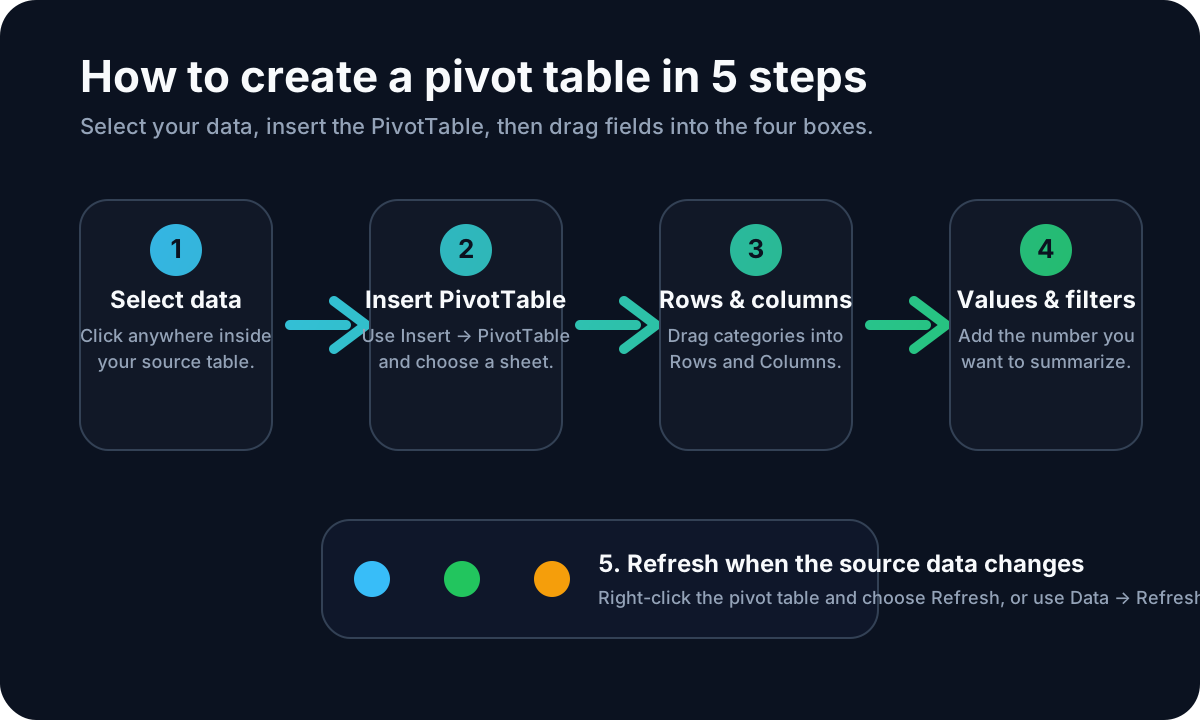
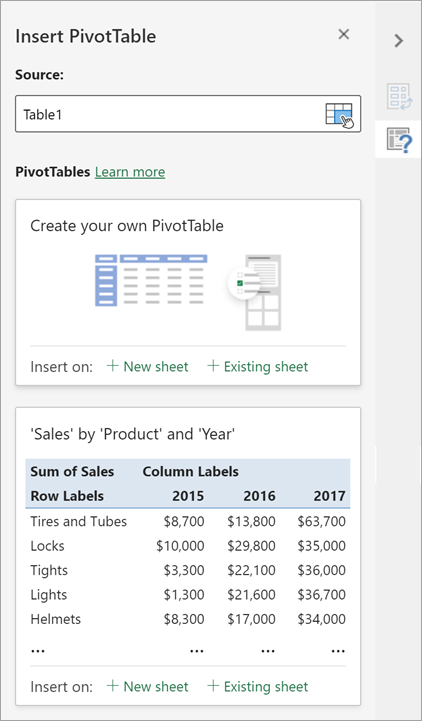
The workflow is simple enough to memorize: select the data, insert the PivotTable, choose a destination, drag fields into the pane, pick the summary type, and refresh when the source changes. Microsoft’s Insert PivotTable pane is built around exactly that sequence.
-
Select your data
Click anywhere inside the table or range you want to summarize. I always make sure the source data has headers in the first row and no blank rows inside the range.
-
Insert a PivotTable
Go to Insert → PivotTable. Excel will ask where the data lives and where you want the report to go.
-
Choose the location
I usually place the pivot table on a new worksheet. That keeps the report separate from the raw data and makes the workbook easier to maintain.
-
Drag fields into the four boxes
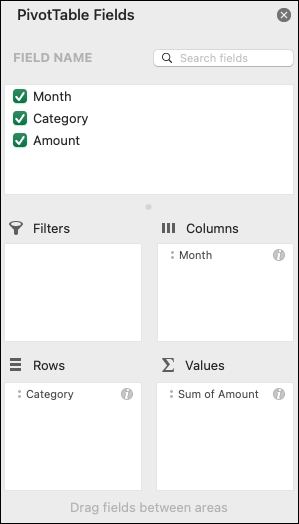
In the PivotTable Fields pane, I place fields into:
- Rows for vertical labels
- Columns for horizontal labels
- Values for the number I want to summarize
- Filters when I want one control to narrow the whole report
-
Adjust the calculation
By default, Excel often uses Sum or Count. If I need Average, Max, or another summary, I change that in Value Field Settings.
-
Refresh when the data changes
When new rows get added, I right-click the pivot table and choose Refresh. That rebuilds the summary from the latest source data.
How to read the PivotTable Fields pane
The PivotTable Fields pane is just four buckets—Rows, Columns, Values, and Filters—but those buckets control almost everything the report does. Microsoft’s docs show the same layout, so once you learn where each field belongs, the tool starts feeling predictable.
Rows
Rows decide what appears down the left side of the report. If I drag Region into Rows, I get one line per region.
Columns
Columns create side-by-side groupings. If I drag Product into Columns, Excel can show me one column per product category.
Values
Values are the numbers I want to calculate. This is where I put sales, quantity, counts, margins, or any other measure.
Filters
Filters let me narrow the report without rebuilding it. If I drag Year into Filters, I can switch the report between time periods very quickly.
If I want a deeper walkthrough of grouped reports, see Numbering Grouped Data for Pivot Tables and Excel Weighted Average Pivot Table.
What Microsoft’s official workflow adds
Microsoft’s support article confirms five source paths — table, range, external data, the data model, and Power BI — and it shows the Insert PivotTable pane and field list in one place. That matters for beginners because the workflow stays the same even as the data source changes.
That matters because beginners often think a PivotTable is only for one specific kind of worksheet. In reality, the workflow is flexible enough to handle normal tables, larger data models, and even cloud-connected sources. Microsoft also reminds you that PivotTables need to be refreshed when the source data changes, which is why I always build that habit into my workflow from day one.
A few practical takeaways from the official workflow:
- Use a clean table or range first. That keeps the source easy to refresh and extend.
- Treat the field list as the construction zone. The PivotTable itself is just the output; the pane is where the real work happens.
- Expect to revisit Value Field Settings. Sum is the default, but count, average, and percentage-style summaries are often more useful.
- Refresh after you add rows. If the dataset changes, the summary needs one more click.
Those are small habits, but they make PivotTables feel predictable instead of mysterious.
If you remember only one thing, remember this: the PivotTable is not the spreadsheet itself; it is a view on top of the spreadsheet. That little mental shift makes the tool much easier to trust. Once the source data is clean, the fields are placed correctly, and the report is refreshed at the right time, you can move from question to answer in just a few clicks.
The nice part is that the same workflow scales well. A tiny budget sheet, a five-thousand-row sales export, and a larger model-driven workbook all start with the same idea: select the source, choose the fields, summarize the values, and refine the result until it answers the question you care about.
Common pivot table mistakes
Most pivot-table mistakes are data hygiene mistakes: blank rows, stale refreshes, and the wrong field in Values. Microsoft explicitly tells users to refresh when source data changes, which is why the clean-source / refresh habit matters more than any formatting trick.
1. Leaving blank rows inside the source data
Excel likes clean, contiguous tables. Blank rows can break the selected range or make the pivot table miss new records.
2. Forgetting to refresh
A pivot table does not always update itself when the source data changes. If the summary looks stale, refresh it first.
3. Putting text fields in Values by accident
If I drag a text field into Values, Excel usually counts it instead of summing it. That is fine when I want counts, but it can be confusing if I expected totals.
4. Expecting a pivot table to keep the original order
A pivot table reorganizes the data. If I need the source rows in a specific order, I should sort the source table or use a formula-based approach.
5. Using a pivot table for row-level logic
If I need to calculate something line by line, a pivot table is the wrong tool. That’s when formulas, helper columns, or Power Query are the better choice.
When to use a pivot table, and when not to
Pivot tables are strongest when the question is summary-first and the workbook can tolerate refresh-based reporting. This article still pulls 12,100 monthly searches at KD 9, which is a good reminder that people want the plain-English threshold for when to use the tool and when to stick with formulas.
- Which product category sells best?
- How do totals change by month?
- Which region has the highest average order value?
- How many rows belong to each customer segment?
I avoid pivot tables when I need:
- a custom report layout that Excel keeps rearranging
- a formula on every row of the source data
- a report that must stay visually fixed for presentation
- live calculations that should update without a refresh
For those cases, formulas often fit better. If I need grouping logic before the pivot table exists, Numbering Grouped Data for Pivot Tables is the next article to read. If I need a more advanced summary calculation, Excel Weighted Average Pivot Table shows the next step.
A quick mental model
The easiest model is group, summarize, rearrange. That tiny sequence is why pivot tables can answer ‘what happened?’ questions so quickly, and it matches the same 12,100-monthly-search beginner intent I am writing for here, at KD 9, without extra formulas or a complicated setup.
- Group the rows
- Summarize the numbers
- Rearrange the output into a report
That’s why pivot tables are so popular. They let me answer “what happened?” questions without rewriting the workbook every time I want a different view.
FAQ
If you just want the short version, the answers below cover the questions beginners ask most, and they all sit inside the same 12,100-monthly-search question set at KD 9. The basics here are enough to get started without memorizing formulas first.
What is a pivot table in simple terms?
A pivot table is a summary table. It takes many rows of data and rolls them up into totals, counts, averages, or comparisons that are easier to read.
What is the difference between a pivot table and a formula?
A formula usually calculates one result at a time. A pivot table groups a whole dataset and calculates summaries automatically.
Can pivot tables handle dates?
Yes. I can group dates by month, quarter, or year, which makes trend analysis much easier.
Do pivot tables update automatically?
Not always. If the source data changes, I refresh the pivot table so Excel rebuilds the summary.
What should I learn next after pivot tables?
I usually move on to grouping data, calculated fields, and weighted averages. Those are the natural next steps once the basics feel comfortable.
Next step
If this guide helped, the next two articles deepen the same workflow from opposite angles, and they keep the same topic cluster anchored in a 12,100-monthly-search keyword. One shows how to prepare grouped data; the other shows a more advanced weighted-average summary.
